How Many Of Each Kind? Project Reflection
Self Assessment and Reflection
For the past few weeks in math, we have been working on the “How Many of Each Kind?” problem. From this problem, I have learned that patience, time, and the ‘guess and check’ method have been very useful. The problem looked fairly simple at the beginning, but a lot of time and work had to be put in to find the final answer. I believe that I deserve an A (23-25/25) because I worked hard throughout this project and helped my group as much as I could. I participated in our discussions and worked as much as I could with my teammates to find a solution. I think the three main Habits of a Mathematician that I incorporated into this project were Collaborate and Listen, Conjecture and Test, and Stay Organized. Being in a group was very helpful during this project because we could talk and discuss different methods and ideas we had. We needed to collaborate and work together in order to solve it successfully. Also, there wasn’t always a clear path or solution to look for, so plugging in random numbers to look for patterns was crucial. We didn’t always know how successful our numbers would be, but guessing and checking was helpful to discover possible answers. Finally, staying organized was important because we needed to know which numbers gave us the highest profit and which constraints we needed to follow. When group members were unprepared and unorganized, it was hard to figure out how to solve the problem. Using these three habits, we were able to work as a group to solve a problem, learn the value of the guess and check method, and stay organized throughout the project.
Problem Statement
The problem consisted of a bakery wanting to make the most profit for selling iced and/or plain cookies. They had constraints for amount of dough, amount of icing, preparation time, and oven space. Our job was to find the amount of iced and plain cookies the bakery could make to attain the highest profit. At the beginning of the project, we were all given charts to fill out that allowed us to guess random numbers of iced and plain cookies to make to see how much money we could make. As a class, we found different inequalities to use to ease the process of calculating money, time, or profit. We also graphed the inequalities to find a feasible region that gave us an idea of what kind of numbers would give us the most profit. All these resources were helpful because they narrowed down the problem and made it more direct. Below are my charts and graphs from the project.
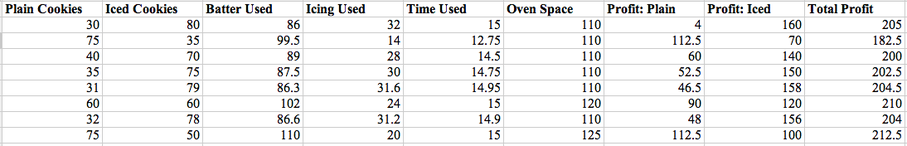
Below is the chart I created to lay out the possible solutions:
For the past few weeks in math, we have been working on the “How Many of Each Kind?” problem. From this problem, I have learned that patience, time, and the ‘guess and check’ method have been very useful. The problem looked fairly simple at the beginning, but a lot of time and work had to be put in to find the final answer. I believe that I deserve an A (23-25/25) because I worked hard throughout this project and helped my group as much as I could. I participated in our discussions and worked as much as I could with my teammates to find a solution. I think the three main Habits of a Mathematician that I incorporated into this project were Collaborate and Listen, Conjecture and Test, and Stay Organized. Being in a group was very helpful during this project because we could talk and discuss different methods and ideas we had. We needed to collaborate and work together in order to solve it successfully. Also, there wasn’t always a clear path or solution to look for, so plugging in random numbers to look for patterns was crucial. We didn’t always know how successful our numbers would be, but guessing and checking was helpful to discover possible answers. Finally, staying organized was important because we needed to know which numbers gave us the highest profit and which constraints we needed to follow. When group members were unprepared and unorganized, it was hard to figure out how to solve the problem. Using these three habits, we were able to work as a group to solve a problem, learn the value of the guess and check method, and stay organized throughout the project.
Problem Statement
The problem consisted of a bakery wanting to make the most profit for selling iced and/or plain cookies. They had constraints for amount of dough, amount of icing, preparation time, and oven space. Our job was to find the amount of iced and plain cookies the bakery could make to attain the highest profit. At the beginning of the project, we were all given charts to fill out that allowed us to guess random numbers of iced and plain cookies to make to see how much money we could make. As a class, we found different inequalities to use to ease the process of calculating money, time, or profit. We also graphed the inequalities to find a feasible region that gave us an idea of what kind of numbers would give us the most profit. All these resources were helpful because they narrowed down the problem and made it more direct. Below are my charts and graphs from the project.
Below is the chart I created to lay out the possible solutions:
Process Description
When I first recieved this problem, I sat down for the entire class period and just chose random numbers to see what the solutions came out to be. As I noticed the numbers that created the most profit, I stayed within their region to find how to increase it. Although we wrote all the inequalities in class, I only really stuck to the charts. Our group talked together and discussed who found the highest numbers, and together we found a solution. We compared with other tables and graphed the inequalities to see if it really was the highest possible number. Our group did work together a lot in class, but when we were filling out our charts, we all did it individually so everyone would have different answers to share. I think that the chart was the most helpful tool for me, and using Desmos.com to graph the inequalities helped me visualize the problem.
Solution(s)
The highest solution that I found was for the bakery to make 75 plain cookies for $1.50 per dozen and 50 iced cookies for $2.00 per dozen. The bakery made $212.50 while still staying within all constraints. They did not exceed oven space, prep time, dough, or icing amounts. They will make a total of 125 dozen cookies (140 dozen was the maximum), they will use all the prep time possible, they will use all the dough possible, and 20 out of 32 pounds of icing. I believe that this is the final and maximum possible solution because if you graph the inequalities, the feasible region is bound by the coordinates (0,80), (30,80), (75,50), and (110,0). If you substitute all these coordinates into the equation 1.5x+2y=profit, it is clear that (75,50) makes the most profit.
Plain and iced cookie designs are below: